Property Investment ROI Calculator

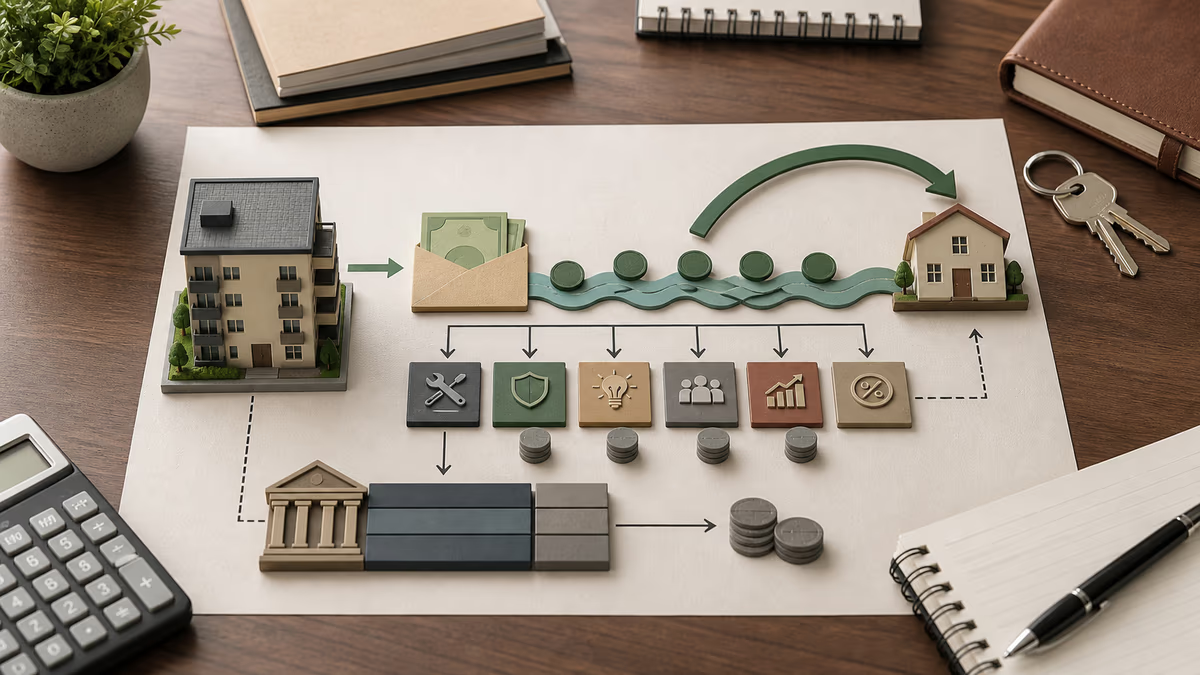
Property investment ROI introduction
This property investment ROI calculator helps answer the question behind most rental offers: after the mortgage, vacancy, upkeep, and exit costs, does the deal really justify the cash you put in? A building can look appealing because the neighborhood is improving, the asking rent seems strong, or the broker emphasizes future appreciation. The return picture changes once financing, operating expenses, management, and the eventual sale are all placed in the same model. This page brings those moving parts together so you can estimate both the monthly income profile and the longer-term return from a rental property.
The calculator focuses on three numbers that are useful when comparing acquisitions. First, it estimates monthly cash flow, which shows whether collected rent can cover recurring costs and the mortgage. Second, it calculates cash-on-cash return, a straightforward way to compare annual cash flow against the cash you invested up front. Third, it projects ROI over your chosen holding period by combining cash flow, appreciation, principal paydown, and selling costs. Looking at the three together keeps a headline number from hiding the financing or operating details that matter in a real purchase decision.
How to use the property investment ROI calculator
Start with the acquisition details for the property investment ROI calculation. Enter the purchase price and the down payment in dollars. Those two numbers set the loan size. Then enter the loan interest rate and loan term. The calculator treats the rate as an annual percentage and converts it into a monthly mortgage payment using a standard amortization formula. If you are comparing financing options, keep every other input the same and change only the rate or the down payment. That makes it much easier to see how financing shifts monthly cash flow and long-term return.
Next, enter the operating assumptions that describe how the property performs once you own it. Monthly rent should reflect realistic rent actually collected, not the best possible case. Monthly expenses should include recurring costs such as taxes, insurance, repairs, HOA dues, utilities you pay, and routine maintenance. The calculator expects these as monthly amounts, so if you normally think of taxes or insurance annually, divide them by 12 before entering them. The vacancy rate is the share of rent you expect to lose to turnover or unoccupied months. The property management field is a percentage of collected rent, which is useful whether you already use a manager or simply want to budget for one.
Finally, enter your longer-range assumptions. Annual appreciation rate estimates how fast the property value grows. Selling cost rate estimates the percentage lost to agent commissions and closing costs when you sell. Years to project ROI sets your holding period. When you click Calculate, the results area will show monthly cash flow, annual cash-on-cash return, the estimated property value after selling costs, and the projected ROI across your chosen time horizon. Use the Copy Result button to move the summary into a spreadsheet, notes app, or side-by-side comparison document.
A practical way to use the calculator is to run it more than once with conservative assumptions. Begin with a base case that feels realistic, then create a second case with slightly lower rent, higher expenses, or higher vacancy. If the deal only works in the most optimistic version, that is useful information. Strong rentals usually remain understandable even after you stress the assumptions a little. Scenario testing is where a calculator like this becomes more than a one-time estimate; it turns into a quick underwriting habit.
If you are new to rental analysis, keep the units straight. Cash inputs on this form are in dollars. The rent and expense fields are monthly amounts. The vacancy, appreciation, management, loan rate, and selling cost fields are percentages, so enter values like 5 for 5% rather than 0.05. Projection years are whole years. The calculator does not ask for taxes, depreciation, or inflation adjustments, so treat the output as a practical screening estimate rather than a full tax model.
- Purchase price and down payment determine how much debt you take on and how much cash you commit on day one.
- Interest rate and loan term affect the monthly mortgage payment and how quickly principal is paid down.
- Rent, expenses, and vacancy drive operating performance and make the biggest difference to short-term cash flow.
- Management rate helps you budget for professional oversight or the value of your own time.
- Appreciation, selling cost, and projection years shape long-term wealth creation and eventual exit proceeds.
How this property investment ROI calculator evaluates a rental
This property investment ROI calculator estimates three core metrics: monthly cash flow, cash-on-cash return, and projected long-term ROI. It combines your purchase price, financing terms, rental income, and operating expenses to model yearly performance. By layering appreciation, management fees, and selling costs into the projection you see a more realistic picture of total return than a simple rent-minus-expense estimate.
In plain language, the calculator first works out what the property earns after accounting for vacancy and operating costs. It then subtracts the mortgage payment to estimate spendable monthly cash flow. After that, it projects what the property could be worth at the end of your holding period, subtracts selling costs, estimates the remaining loan balance, and combines those figures with accumulated cash flow. That final step is what turns a short-term operating snapshot into a longer-term return estimate.
Property investment ROI formula overview
The core formulas follow standard real-estate underwriting:
- Net operating income (NOI):
- Monthly cash flow:
- Cash-on-cash return:
- Total ROI after years: combines accumulated cash flow, equity paydown, appreciated value, and selling costs.
The loan payment uses the standard amortization expression , with as loan amount, as monthly rate, and as total payments.
These formulas matter because they separate operating performance from financing structure. Two properties with identical rents and expenses can behave very differently if one has a high-interest loan and the other does not. Likewise, two investors can buy the same building but see very different cash-on-cash returns because one uses more leverage and one puts more money down. This calculator helps you test those relationships quickly instead of relying on rough intuition.
Interpreting property investment ROI results
Cash flow shows your monthly profit after mortgage, expenses, and vacancy assumptions. Positive cash flow means the property covers its own costs and produces income from day one. Negative cash flow does not automatically make a deal bad, but it does mean you are relying more heavily on appreciation, loan paydown, future rent growth, or a later refinance. In practice, negative cash flow also reduces your margin for surprises such as repairs, slower leasing, or rising insurance costs.
Cash-on-cash return divides annual cash flow by upfront cash invested. Investors often compare this number to alternative uses of cash because it answers a simple question: for every dollar I put in, how much annual cash am I likely to receive back? Higher leverage can sometimes make this percentage look better, but leverage also raises risk because the mortgage payment leaves less room for vacancies and expense spikes. That is why it is worth reading cash-on-cash return together with monthly cash flow rather than by itself.
Projected ROI tries to capture the bigger investment story. It includes the cash flow you collect along the way, the principal your tenants effectively help pay down through the mortgage, the possible rise in property value from appreciation, and the friction of selling. A high projected ROI with weak monthly cash flow may point to a long-term appreciation play. A modest projected ROI with strong monthly cash flow may appeal to investors who prioritize dependable income and resilience. The best result is the one that matches your strategy, risk tolerance, and time horizon.
Worked example: a leveraged rental purchase
Imagine a duplex purchased for $300,000 with a $60,000 down payment, a 6% fixed mortgage over 30 years, monthly rent of $3,000, monthly expenses of $900, a 5% vacancy rate, and an 8% management fee. Assume 3% annual appreciation, 6% selling costs, and a 10-year hold. In that case, the calculator will estimate a mortgage payment on the $240,000 loan, reduce rent for vacancy, subtract expenses and management, and produce a monthly cash-flow figure. It will then project the property value forward for 10 years, estimate the remaining loan balance, apply selling costs, and combine those figures with the cash flow collected during the hold. This is exactly the kind of example that shows why a rental can feel average on a monthly basis but still create meaningful total return over time.
If you change just one assumption in that example, the picture can shift quickly. Raising vacancy from 5% to 8% cuts collected rent every month. Increasing the down payment lowers the mortgage payment and usually improves cash flow, but it also means more cash is tied up in the deal, which can reduce leveraged return. Cutting expenses or increasing rent may help both monthly cash flow and ROI, but only if those changes are realistic. That tension between safety and leverage is one of the main reasons investors model several cases before making an offer.
Property investment ROI scenario planning
A property investment ROI calculator becomes most useful when you treat it as a scenario tool rather than a one-answer machine. The table below shows how a few common changes can push the result in noticeably different directions.
| Input tweak | Effect on ROI |
|---|---|
| Increase vacancy from 5% to 10% | Lowers annual cash flow and delays break-even |
| Add 8% management fee | Reduces cash-on-cash return by several points but saves personal time |
| Raise appreciation from 2% to 4% | Boosts long-term ROI due to higher sale price and equity |
Use the copy button to paste outputs into a spreadsheet and compare multiple purchase scenarios side by side. Many investors keep one optimistic case, one realistic case, and one deliberately conservative case. That simple habit can reveal whether the property still works after you allow for imperfect leasing, higher repairs, or a softer resale market.
Who benefits from this property investment ROI calculator
New investors can use the calculator to learn how financing and operations interact before making an offer. Experienced landlords can compare alternative down payments, refinancing assumptions, rent levels, or management choices. Agents, analysts, and advisors can use it as a fast client-facing illustration tool when discussing whether a property is likely to behave more like an income asset or more like a long-term appreciation bet.
Property investment ROI limitations and next steps
The calculator assumes a fixed interest rate, steady rent, constant appreciation, and consistent expenses over the projection period. Real properties are messier. Insurance can jump. Taxes can rise after reassessment. Repairs arrive unevenly. Vacancy tends to happen in chunks rather than as a perfectly smooth percentage. The tool also does not account for income taxes, depreciation recapture, capital gains treatment, financing fees, major capital expenditures, or the time value of money. Those omissions do not make the calculator useless; they simply define what it is best at. It is a screening and comparison tool, not a full institutional pro forma.
For a more complete investment decision, take the output from this page and layer in the details that matter for your market. Review rent comps, local tax rules, reserve requirements, planned renovations, and your expected exit strategy. If a property only looks attractive because you used aggressive appreciation or unusually low expenses, you may want to revise the assumptions. If it still looks solid after conservative adjustments, the result is much more informative. Good underwriting is less about producing the highest number and more about producing a believable one.
Mini-game: Deal Tuner Dash
This optional arcade mini-game turns property investment ROI underwriting into a fast puzzle. Tune each property by adjusting down payment, rent, and expenses until the projected ROI lands in the green target band while monthly cash flow stays positive. It does not change the calculator result above; it is simply a quicker way to feel how leverage, rent, and operating costs push a rental deal around.